Features
This section describes some of the more important features of maps offered by ScalableMaps.
Vector Data
All of our maps are vector maps. This means that they contain vector graphics objects (lines, texts etc.) which scale as you zoom in in your graphics editor. So there is no inherent "resolution" to the data as such, except for raster features ( see Rasters section for more information).
Let us examine a sample London map to see how the vector graphics objects appear at the increasing zoom levels: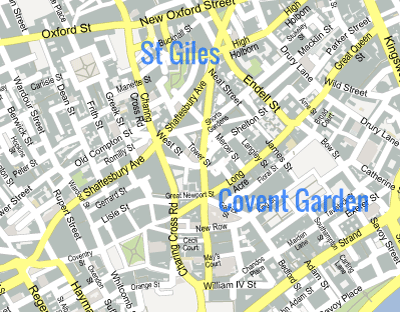
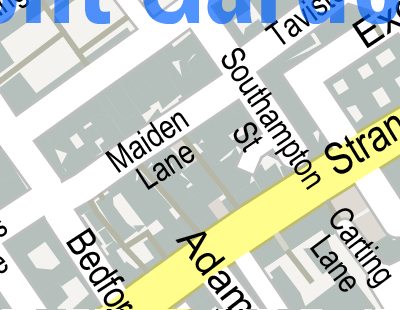
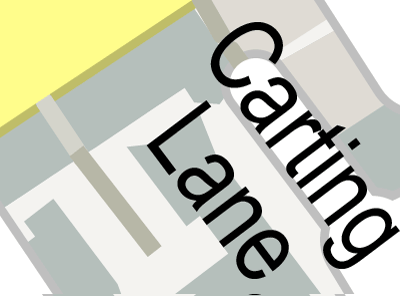
 Sample London map shown at increasing zoom levels
Map Sources
Our maps are made using various geographical data sources. City maps use OpenStreetMap (OSM) project data. OSM is the project that creates and distributes free geographic data for the world. All the creating, editing and maintaining of the OSM data is done by volunteers. The data typically includes very detailed geographical features (complete road network, bicycle and foot paths, building shapes), although the actual quality of coverage varies around the world - countries with a lot of OSM volunteers (like Germany, UK and Netherlands) have much denser data coverage than those with fewer volunteers. You can use OpenStreetMap's online map to browse to your place of interest and check the data coverage there.
For continental maps and some world maps, we use Natural Earth data, which is a public domain map dataset for smaller-scale maps. The data comes in three different scales, including 1 : 10 million scale, which is the most detailed of the three. Natural Earth dataset includes rasters for features like shaded relief, hypsometry and ocean bottom (for more information about the raster features on our maps, please visit the Rasters section).
Some world maps are made using NASA’s Visible Earth imagery, a catalog of NASA images of Earth.
The map sources described above have different terms of use (defined by data owners, not ScalableMaps). Please visit our Terms Of Use page for more information.
Map Themes
Various map themes are available in the ScalableMaps store, depending on the type of the map and the map scale. You can try out some of these map themes by downloading one of our sample maps.
High-Detailed City Themes
For high-detailed city maps (map scale around 1 : 10,000), we offer four themes: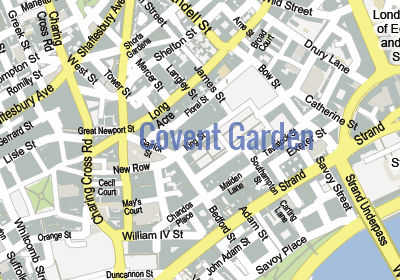 Gmap city map theme
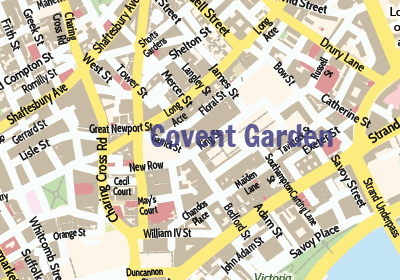 Colorful city map theme
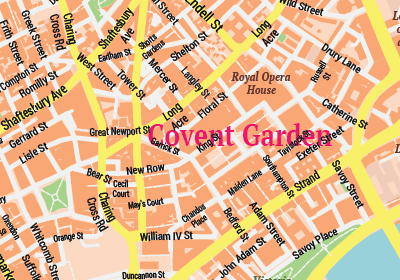 Classicity city map theme
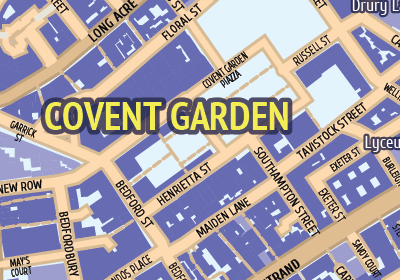 Modern city map theme The Modern theme is designed for even more detail (map scale 1 : 5,000), so it is also suitable for maps showing just parts of a city. The typical size of the area that can be covered by these themes is 10 x 10 kilometers. These themes show street labels even for minor streets (where possible - see Labels section for more information) and buildings shapes (if available in the underlying OpenStreetMap data).
Metro City Themes
We also offer two map themes that are designed for maps covering larger metropolitan areas: GMap Metro and Black & White, No Labels themes.
GMap Metro theme can cover areas of 25x25 kilometers or even more. In order to be able to cover such large metropolitan areas, the map shows labels for major streets only and it does not contain building shapes (see the Level Of Detail section for an explanation):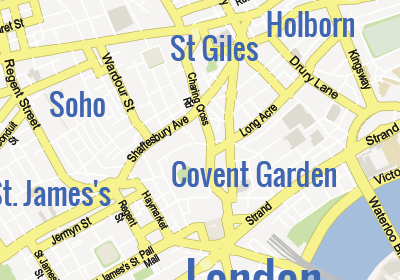 Gmap metropolitan map theme
Black & White, No Labels is a new theme which we have just started to roll out. It is highly stylised and it only shows transportation network (roads and railways) as simple, black and white line artwork, without any labels.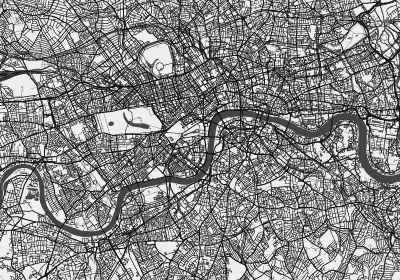 Black & White, No Labels map theme As such, it can cover very large areas of high urban density.
Continental Themes
For maps covering parts of continents or whole continents, we use Natural Earth data. There are various themes available, including the following two:![]() Shaded relief + transportation theme
Shaded relief + transportation theme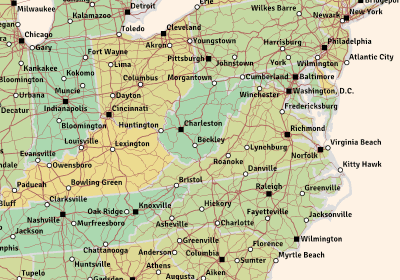 Low scale road network theme
NOTE: Themes that show shaded relief use Natural Earth's rasters which are designed for on-screen use for map scales around 1 : 10 million. Their low DPI resolution is not really suitable for printing purposes.
World Themes
We offer several different map themes covering the whole world globe. Some of them are based on Natural Earth raster data and some use NASA’s Visible Earth imagery. For the overview of the available world maps, please visit the World maps page.
Map Scale
Maps come in different map scales. The scale of the map tells you what the real-world distance is for a given distance on the map (like one centimeter or one inch). For example, city maps usually come in map scale of 1 : 15,000. This means that one centimeter on the map represents 150 meters in the real world.
You can use the map scale to also calculate the physical size of the map (when printed). Each map in our store displays its map scale and physical size on the map page: Map scale and size information
Maps are often classified into small, medium and large scale. Large-scale maps cover smaller areas, like cities. Medium-scale maps usually cover country-sized areas, while small-scale maps are used for continent and world maps.
Level Of Detail
Large-scale maps can show greater level of detail. For city maps, this means the maps can even contain building shapes, footpaths and other features which are impossible to show on small-scale maps. On the other hand, small-scale maps can cover larger land areas. So there is always a trade-off between being able to show as much of detail as possible and being able to cover larger areas.
There are several factors that limit what level of detail can be achieved for a given map scale and area size:
- The size of the features on the map: as the map scale decreases, features become too small to be shown on a map. Buildings, for example, cannot really be represented as more than simple dots on medium-scaled maps and are impossible to show on small-scale maps.
- The number of objects in the vector file: there is a limit of how much content (graphics objects) a vector file can contain. Each object takes up only a small amount of computer memory, but high-detailed maps can contain tens or even hundreds of thousands of such objects. Loading a large vector file in the vector graphics editor can take up several gigabytes of computer memory. Manipulating large vector files also requires a lot of computer processor power. If the file is too large, it will cause the editor to become very unresponsive and slow (best case) or it will even be impossible to load the map into the editor (worst case).
- The physical size of the map: vector graphics editors usually limit the size of the editable workspace. For example, Adobe Illustrator limits the size of the artboard to 577 x 577 cm (227 x 227 inches). This directly affects how large the map can be, for example at 1 : 15,000 map scale you can not cover more than 86 x 86 km (53 x 53 miles) of territory.
Layers
Maps typically contain various kinds of objects, from roads network (with different categories of roads), to landuse shapes and place names. In order to work more easily with the map, it is useful to have these different object types grouped into separate layers so they can be manipulated as a single entity or switched off completely if not needed for the final map product.
Our maps, too, are layered. Here is a screenshot of Adobe Illustrator's Layers panel showing some of the layers of a sample city map: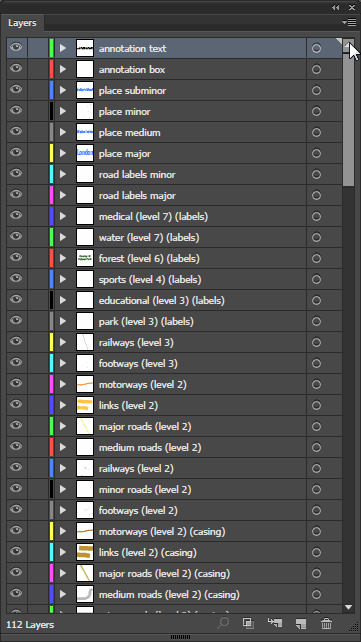 Layers of a sample map in Adobe Illustrator The layers on the top of the list will be drawn on top of the layers that are further to the bottom. The vector graphics editor does this by rendering the layers in the bottom-up sequence (this is called the painter's algorithm). In the above example, this means that the motoways (level 2) layer will be rendered before the road labels major layer - this allows the road name label to be drawn on top of the road line artwork:
 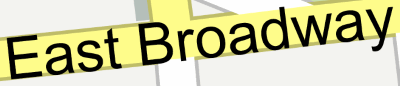 Road label rendered over road lines
Sometimes the rendering order makes it impossible to organize all the related map objects into a single layer. One example may be a park which contains a lake, which in turn holds an island with a smaller park. In this case, the map has to contain at least two separate park layers, one (lower) layer for the bigger park and one (higher) layer for the park on the island. ScalableMap maps mark such layers with the "(level N)" name, where N is the rendering level (higher levels get rendered above lower ones).
Styling
All of the objects present in our maps are fully editable. You can change their style (color, width etc.), move them or even completely remove them from the map. You can manipulate them as individual objects or as single layer, depending on your needs.
There are some constraints in editing label texts, please visit the Labels section for more information.
Labels
Most of maps in the ScalableMaps store contain textual labels for place names, points of interests, roads and other geographical features. The labels are grouped into layers, depending on the feature type they represent, importance and the style used for the label text.
Labels Placement
One very important feature of map labels is that they should not overlap each other. This is sometimes very difficult to achieve, especially for very dense, high-detailed city maps, since there are a lot of streets which cross one another and we want as many of these streets to be clearly labeled using their names. Label placement is one of (if not the) the hardest problems in cartography and it takes long hours of manual work to get the labels placed "perfectly" for traditionally made maps. This is one of the reasons such maps are quite expensive.
Our maps are made using advanced automatic label placement algorithms which employ various techniques to place the labels in a legible way without the overlaps. These techniques include:
- abbreviating the labels (using standard map abbreviations for a specific language),
- splitting the labels into multiple lines so they can fit short street/road segments,
- reducing the font size or narrowing the font horizontally,
- removing less important labels in favor of more important ones.
Below are some samples of our label placement algorithm in action: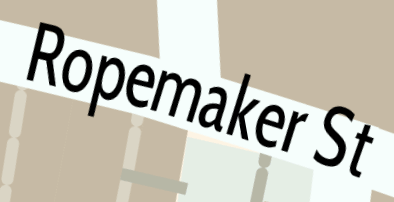 Label with abbreviated text
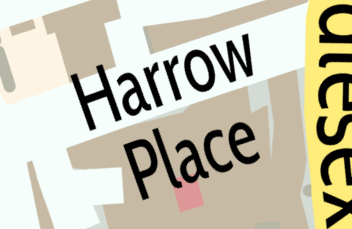 Label split into multiple lines
As this is an automatic process, it is not a perfect one. Sometimes a certain label just cannot be placed on the map because there just is no space for it, especially on smaller-scale maps.
Editing Of Labels
Since each letter of the text label needs to be placed precisely in a specific location, we cannot rely on simple "text on path" placement algorithms used by various graphics editors. Instead, the label is split into parts that fit well with the road curvature and each part is placed as a separate object on the map. Such an object is still a pure, editable text object (and not text turned into geometric shapes). The following screenshot shows a sample "Kneeland Street" label, split into several parts, with the first part ("Kneel") selected: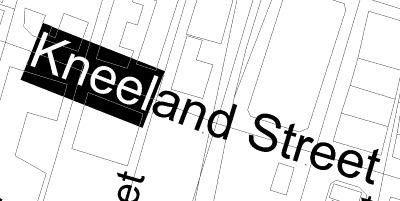 Structure of a sample text label While the text label objects are still fully editable as texts, changing the text style (font, size, weight etc.) and the text itself could cause the label to be mangled or to start overlapping other labels. This is an unfortunate price that needs to be paid for having a cartographically precise placement of labels regardless of what vector graphics editor or printing software you use.
If you need a different font or text style applied to one of our maps in the store, we can make a custom map for you with the style of your choice. Please visit the Using Different Fonts section for more information.
Fonts
Fonts used in ScalableMaps maps are either standard ones that come installed on most modern operating systems or they are available in the Google Fonts catalog. All the fonts used are royalty-free and can be used both for non-commercial and commercial purposes.
The map package you receive when you purchase a map from our store will contain all the fonts used for the map, either as .ttf files or embedded in the map file itself (depending on the map file format). For more information on how to use these fonts, please visit the Using Maps page.
Rasters
Some maps (especially continental and world themes) in our store contain raster (bitmap) data, which, by its nature, is not scalable. While we strive to provide you with the best DPI resolution for these rasters, it is very hard to find free sources of high-detailed geographical raster data. Also, the high-resolution rasters require huge amounts of disk and memory space and can be quite demanding on the user's computer.
On the main page for each map you can see the raster DPI resolution (if rasters are used) and the size of the file package, like in the following example: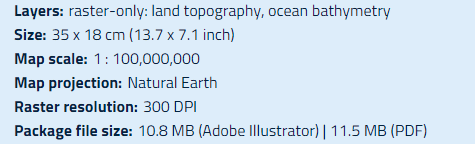 Raster information for a sample map